Ever thought – How are your eToro User Stats calculated? Well, wonder no more!
** If you don’t have an eToro account – you can set one up here! **
** Already have an eToro account? Check out my profile! **
67% of retail investor accounts lose money when trading CFDs with this provider. You should consider whether you can afford to take the high risk of losing your money.
Note that this does not apply to US Users and eToro USA LLC does not offer CFDs.
What are the eToro User Stat categories?
The user stats page on eToro is probably the most important page you need to look at in order to make a copy decision.
The new stats page is built out of 5 cards:
- Performance
- Risk
- Copiers
- Trading
- Additional info
Let’s find out how your eToro User Stats are calculated.
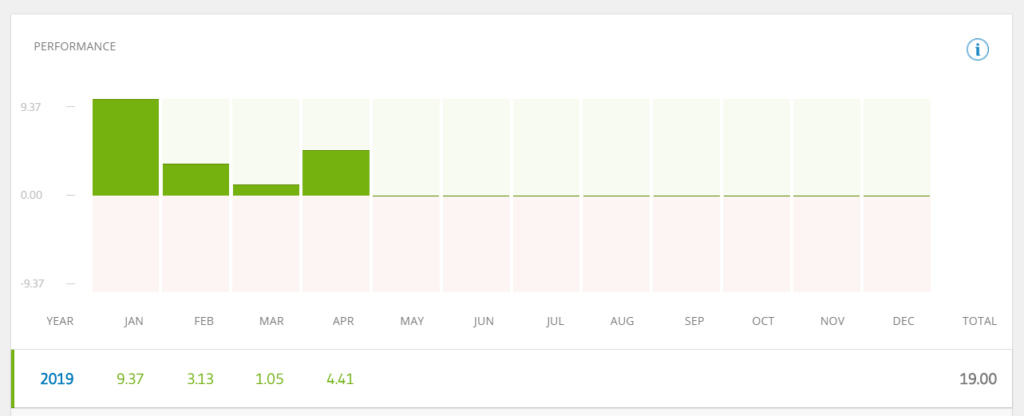
1. Performance

eToro went with a completely different approach here, viewing each user and potential copy as an investment fund. As such they’ve aligned with industry standards and are now showing monthly and yearly returns. You can see the monthly returns both in a clear table as well as in the accompanying bar chart.
Along with this new approach, they’ve also changed the way they calculate monthly performance. They no longer use the modified Dietz formula, which has raised many questions among you, due to its complexity. Instead, they decided to go with this simple formula:
I’ve also included an excel spreadsheet at the end of this post that you can use to calculate the user stats.

Where:
E1 – is the equity at the end of the month
W – is the total withdrawals made within the month
E0 – is the equity at the beginning of the month
D – is the total deposits made within the month
To explain: this formula simply represents the net change in equity during a given month.
For example:
Let’s imagine that in January you had a starting equity amount of $1200, you lost $300 through trading, and deposited an additional $800. Later that month you gained $1100 through trading so that on the last week of January you had $2800 in your equity. You decided to withdraw $500 to buy something nice to yourself, and therefore your account equity at the end of January was $2300. So what was your return for January?
E1 – $2300 is the equity at the end of the month
W – $500 is the total withdrawals made within the month
E0– $1200 is the equity at the beginning of the month
D – $800 is the total deposits made within the month /p>
The return for January was therefore: 40%.
The yearly performance is calculated traditionally by multiplying the monthly returns throughout the year.
If the returns over 12 months are r1,r2,r3….r12 then the yearly return is:
(1+r1)(1+r2)…(1+r12) -1
So if these are the monthly returns:

The yearly return is:
(1+0.035)(1+0.01)(1+0.1)(1-0.15)(1-0.02)(1+0.07)(1+0.06)(1-0.05)(1+0.04)(1+0.12)(1-0.08)(1+0.03)-1=13.92%
2. Risk
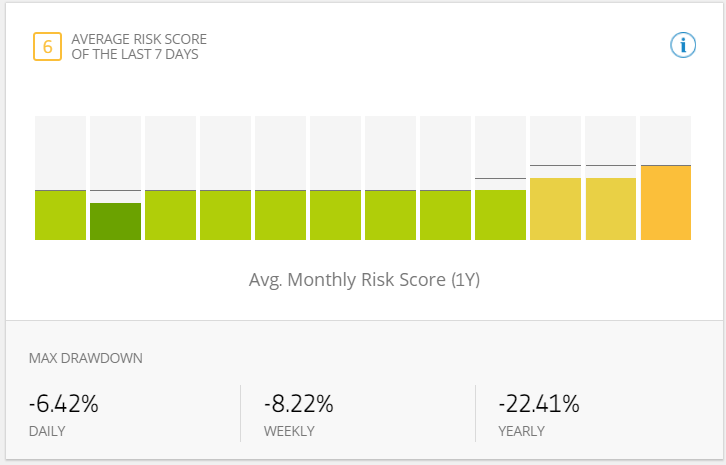
As the old saying goes, there’s no reward without risk, especially in the financial markets.
The returns shown in the performance card, were not achieved without risk, and it’s important to know and understand the risks that the investor is likely to take going forward.
eToro is introducing the Risk Score – based on industry standard risk assessment calculations (VAR), the risk score shows the risk the investor is taking on a scale of 1 to 10, where 1 means very low risk and 10 means extremely risky (as in – likely to blow out the account without taking restrictive measures).
The risk card shows the following elements:
Current risk score – is actually the last 7 day average of the user’s risk score. We’re using an average here because risky traders can close all of their positions to try and lower their risk, however it is the average that tells the real story.
Monthly Average Risk Score – this bar chart shows the monthly risk score average over the last 12 months. Compared with the performance table above, it shows you the real risk and reward picture. It also shows you the history of the investor from which you can learn about his/her risk-taking tendencies.
Max Drawdown – the max drawdown is the greatest loss the account equity suffered during the selected period (daily, weekly, all time).
3. Copiers

eToro is a social investment network, and its strength is in the wisdom of the crowd. It’s important to learn what the community thinks about an investor, not only in terms of discussions but in terms of actual investments.
The copiers card shows exactly that – the number of copiers currently copying this investor, as well as the copier chart showing copier amounts for the last 12 months and copier trend in the last 7 days, where you can see the change in the absolute number of copiers and in percentages.
This also includes the Copytrader Copy AUM. A figure that represents how much money is currently allocated to copying the investor. This is actually the sum of all of the funds copiers have invested in this trader, shown in ranges of: under $50K, $50K-$100K, $100K-$300K and over $300K.
4. Trading

We’ve covered performance, risk and copiers, but it’s also important to learn how this investor achieved the above results. The trading card shows important information about the user’s trading history and investment style.
The upper part of the card shows total trades and profitability (along with average profit and loss) as well as the portfolio distribution shown as a colored bar.
The lower part of this card shows the investor’s top 3 investment instruments in terms of the number of positions. In other words – what does this investor like to trade? For each of the 3 most frequently traded instruments (markets or people) you can see the number of positions, profitability and average profit and loss.
It’s important to mention, that in generating these stats we no longer see copied trades as your own. This means that the copy action is in itself counted as a trade, with profit or loss, and the copied trades made by the copied user do not count towards your statistics.
5. Additional info
These are other important stats that you should take into consideration when copying a user:
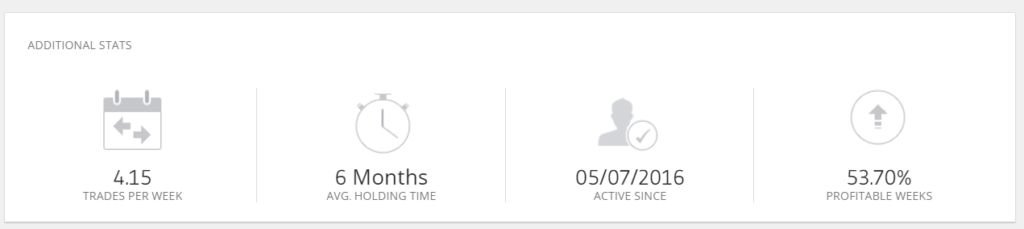
Active Since – This is the date the investor started trading with eToro. It’s important to understand whether you’re looking at a novice trader, who started trading 2 weeks ago, or an experienced investor that’s been trading on our network for over a year.
Trades per Week – How many trades this trader opens every week on average. This is an indication of his/her activity level. A trader with 50 trades per week on average is very active, whereas a trader with less than 3 is more of the long term investor-type.
Average Holding Time – This statistic shows you what kind of trader you’re looking at. Is this a day trader, holding trades open for a few minutes only, or a long term investor holding his/her positions open for months?
Profitable Weeks – Shows what percentage of weeks, since this user started trading with eToro, have been profitable. A high Profitable Weeks rate shows consistency over time.
Now all that’s left to do is head to the eToro and check out the new page for yourselves! Hopefully, this has answered your questions about how your eToro User Stats are calculated.
More information about how etoro user stats are calculated can be found here.
[…] traders trading record/stats. Have a look at the stats tab within the traders’ profile as there are a number of key items to look […]