eToro’s risk score lives to serve the eToro Copy Trader programme and to confuse everyone else. So, at a very high level, it gives users of the platform a quick indication of a particular trader’s risk score and how ‘risky’ their portfolio is on a scale of 0 – 10. With a risk rating of 0 being very low risk and 10 being very risky – scientific stuff.
** If you don’t have an eToro account – you can set one up here! **
** Already have an eToro account? Check out my profile! **
67% of retail investor accounts lose money when trading CFDs with this provider. You should consider whether you can afford to take the high risk of losing your money.
Note that this does not apply to US Users and eToro USA LLC does not offer CFDs.
My issue isn’t the rating of 1-10 but rather lies with how those eToro’s risk score comes about. I’ve been using the platform for nearly six years, and the reasoning/justification behind these scores still baffles me today. I can comprehend that it is a tool that traders can use to see if a particular trader is likely to blow up their account and your funds if you’re copying them. eToro tries to explain these risk factors via complex terms and calculations. However, I think they overestimate their clientele and their ability to care about risk scores. Let’s dive into what they cover on how risk scores are calculated.
How is eToro’s Risk Score Calculated?
The basic idea is that every instrument has an average daily movement, which indicates its volatility. For example, let’s say the market price of instrument X shifts on average around 2% a day (during a given day, it will usually go up or down by around 2% from its price at the beginning of the day). This is basically its daily standard deviation, which is one of the key fundamental risk measures that analysts, portfolio managers, wealth management advisors and financial planners use.
Statistically, if we multiply the average standard deviation by three, we create a range that will be correct 99% of the time. So, in our example, 99% of the time, instrument X will move up or down by a maximum of 6% in a single day.
The above statement from eToro seems fair enough, except for one minor, teeny, tiny detail. There are no risk scores displayed for instruments. You can’t go onto the eToro platform and look at individual instrument risk scores – only traders and copyportfolios.
When they look at individual traders, they factor in each of their positions, say three incantations and voila – there’s the risk score.
Where the eToro risk score comes undone
The calculations take into account each instrument in a portfolio to work out the volatility, then use those figures, along with each instrument’s weight and leverage. However, one critical thing I believe that eToro hasn’t considered is its user base. eToro has several million users across the globe, resulting in millions of users that don’t count English as their first (or second) language. Explaining something very complicated like this doesn’t help – even if it is translated into their mother tongue. Simplifying this would help immensely. What I think should be done instead is that the person’s daily % change is used as their risk score. That is the percentage change of their whole portfolio, not the individual instruments.
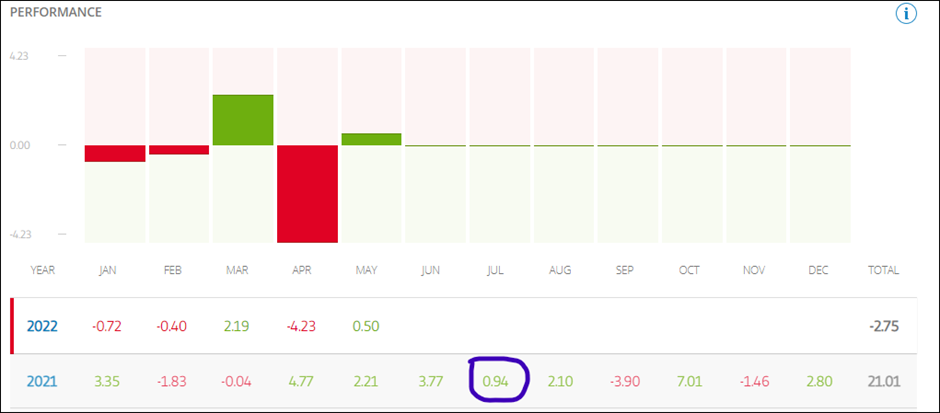
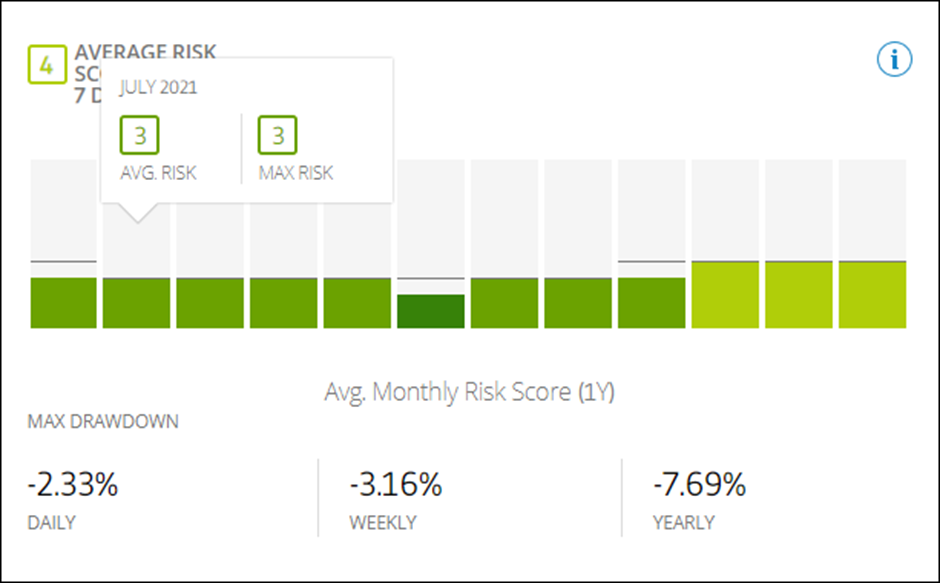
I’ve noticed several times that my monthly risk score doesn’t line up with my month’s performance. So, as I’m a narcissist, let’s look at my portfolio. Below you can see two images – one is my stellar performance over the last 1.5yrs. The next is the risk score for those corresponding months. Some of you astute, detail orientated readers may notice something. The risk scores don’t follow any rhyme and reason for the relative portfolio score.
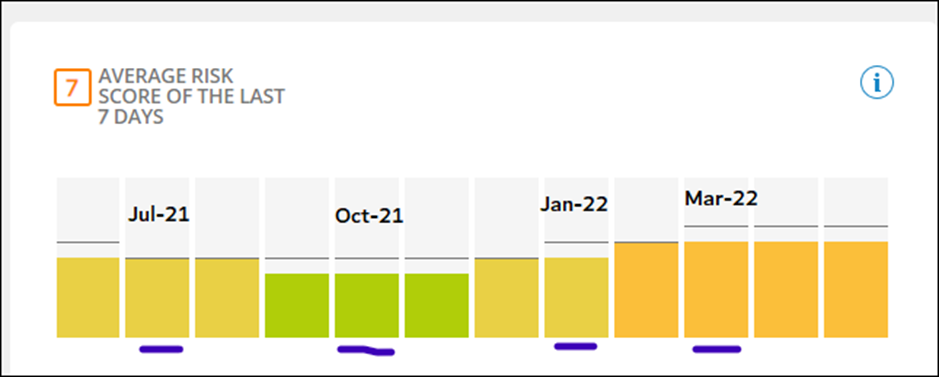
So, in one month, I was negative -14.35% for the month. My average risk score for the month (Jan -22) was 5, hitting a max of 6.
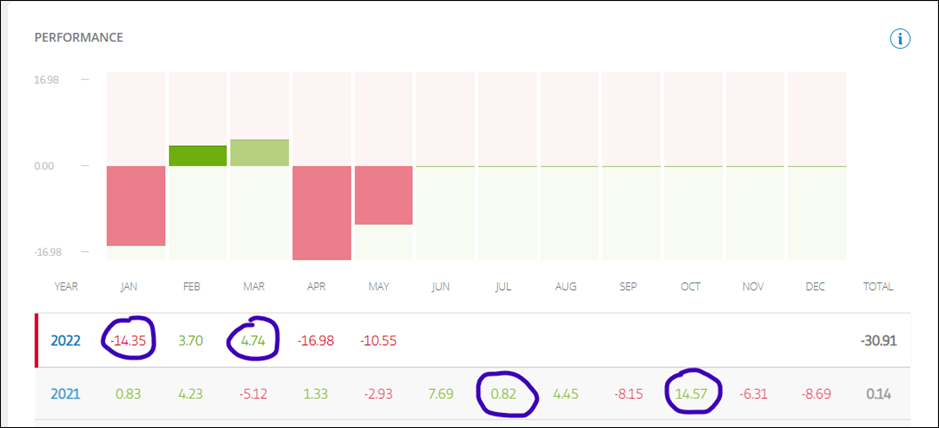
In Mar-22, I had 4.74% portfolio growth, but my average risk score was 6, hitting 7. How is it that my growth was lower in terms of the month from start to finish but higher in risk score? Jan-22 has the same risk score and Jun-21, where I had +7.69% growth for the month… compared to -14.35%. That is a bit of a variance between the two monthly scores, but they share the same risk score.
What about other traders?
To go beyond my profile, check out this other trader. I had a look at their July-21 month, where they had similar portfolio growth to mine (0.82% and 0.94%, respectively). Their risk score was 3 for the month. however, mine was 5…. What?
How can the eToro risk score be improved?
Several things can improve understanding eToro’s risk score. Therefore, simplifying it is probably the easiest way. Do I know the best way – not really, but I think I could take a crack at it. Let’s use their risk score scale of 0-10 and make it easy to understand. Why not associate the risk level to the daily change in portfolio %, then average it over the month. That way, someone whose portfolio grew religiously 0.2% each day would show a relatively low risk each month, even though for the year, their portfolio would have grown +73% for the year. That yearly growth alone would be considered high risk. If I was to explain my proposal to a 5yr old, this is how I would do it. These figures take into consideration +/- swings.
| Growth (+/-) | Risk Score |
| 0.00 > 0.09% | 1 |
| 0.10 > 0.49% | 2 |
| 0.50 > 0.99% | 3 |
| 1.00% > 2.99% | 4 |
| 3% > 4.99% | 5 |
| 5% > 9.99% | 6 |
| 10% > 14.99% | 7 |
| 15% > 19.99% | 8 |
| 20% > 29.99% | 9 |
| 30% + | 10 |
A rudimentary table above I came up with within 5 minutes would clarify so much confusion about how the portfolio changes month to month. The numbers I put above are just guestimates – so it might be worth looking at having a greater range. Indeed, more intelligent blokes are out there who could come up with a better-looking table.
Closing thoughts
As I mentioned above, the risk score only serves to assist popular investors (too high of a risk score may lead to them being copy blocked for a while). It indicates to potential copiers that trader X has this specific risk score, but it doesn’t give much more value than that.
I recommend that eToro simplify the risk score – no need for complicated equations or scientific terms. Keep it simple – daily change = X, and then X gets averaged over the month at the end of the month to ensure an even playing field.
What are your thoughts? Do you think eToro needs to revisit the risk score?