NVDA (NVIDIA Corporation) operates as a visual computing company worldwide. So it operates in two segments, GPU and Tegra Processor. With their earnings report coming up (21 May 2020) I thought it would be a great time to dive in and take a look. So, I’m not going to tell you if you should buy, hold or sell before earnings this Thursday – the information below should help you decide.
I held NVDA in my eToro portfolio.
Quick NVDA overview
- Market cap – US$208.9b
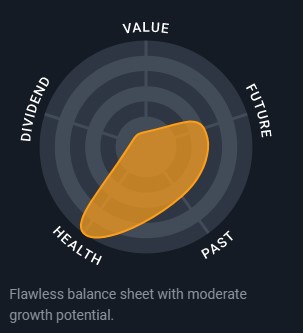
- A flawless balance sheet with moderate growth potential.
- Earnings are forecast to grow 18.91% per year
- Highly volatile share price over the past 3 months

Who is NVDA’s competition?
- $INTC (Intel)
- $AVGO (Broadcom Inc)
- $TXN (Texas Instruments Inc)
- Current Share Price – $339.63
- Highest (3yrs) – $339.63
- Lowest (3yrs) – $127.08
NVDA Market Performance
NVDA exceeded the US Semiconductor industry which returned 24.5% over the past year, so it is a great result.
Shareholder returns including dividends
| Time | NVDA | Industry | Market |
| 30 Day | 16.2% | 1.1% | 1.1% |
| 1 Year | 124.6% | 29.3% | 1.4% |
| 3 Year | 146.7% | 60.0% | 25.4% |
| 5 Year | 1575.6% | 129.2% | 46.1% |
Valuation
Is NVIDIA undervalued compared to its fair value and is its price relative to the market? NVDA is currently calculated to be 244% overvalued against its fair value. Fair value is an estimate of what the stock price is worth today, so based on the cash flows of the company is expected to generate in the future. This means that NVDA is going to have to continually grow and therefore bring in money to justify its high PE ratio
NVDA has a current PE ratio of 73.98x, so is it high compared to the industry average of 31x?
Now let’s look at the Price to Earnings Growth (PEG) Ratio: NVDA is poor value based on its PEG Ratio (3.9x). PEG ratio measures the value of the stock while factoring the company’s forecast earnings growth rate. A PEG over 1 is considered overvalued.
Future Growth
How is NVIDIA forecast to perform in the next 1 to 3 years based on analysts’ estimates? NVDA is expected to increase its forecasted annual earnings growth by 18.9% so that is a positive attribute.
Analyst Future Growth Forecasts
NVDA 18.9% vs Industry 23.2% vs Market 20.7% so it’s growth is on par.
Forecast Annual Earnings Growth
Company 14.4% vs Industry 9.1% vs Market 8.8% so it’s outpacing the annual earnings growth.
This means that NVDA’s forecast earnings growth (18.9% per year) is above the savings rate (2.2%) but slower than the US market (20.7% per year).
NVDA’s earnings are forecast to grow, but not significantly > 14.4% vs 8.8% US market for the year. So what I am excited about is the future return on equity. 27.8% vs 10.3% for the market for over 3 years.
So one of NVDA’s strong points is its financial position. NVDA’s short term assets ($13.7B) exceed its short-term liabilities ($1.8B) and well as its long-term liabilities ($3.3B).
In addition to this NVDA’s debt to equity ratio has reduced from 31.3% to 16.3% over the past 5 years and its debt is well covered by operating cash flow (239.1%). It’s only carrying $2b of debt, so it’s in a fantastic financial position.
NVDA’s dividend is not special sitting at 0.19% but this is OK – they have a high PE so you don’t want them paying out a strong dividend in the company. As the dividend yield has reduced over the years, so their dividends per share price have increased as the stock’s price has increased.
Management
A company is only as good as its management and this shows. Then how experienced are the management team and are they aligned to shareholders interests? The average management tenure is 11.3yrs and NVDA’s board of directors are seasoned and experienced (16.5 years average tenure).
In summary
There are going to be some turbulent times coming up with the earnings report this week 21 May 2020 but this is certainly one stock to hold on to for many years to come.
Are you holding NVDA? Let me know below and check out my other investing reviews.
The analysis above was created with information sourced from Simply Wall St and TipRanks.
