Hi everyone! Each month I’ll be going over my eToro portfolio review for 2020 for the latest month and see how I’m progressing against my 2020 goals.
** If you don’t have an eToro account – you can set one up here! **
** Already have an eToro account? Check out my profile! **
67% of retail investor accounts lose money when trading CFDs with this provider. You should consider whether you can afford to take the high risk of losing your money.
Note that this does not apply to US Users and eToro USA LLC does not offer CFDs.
Final eToro Portfolio Review for 2020
2020 had everything the stock market didn’t expect. Highest highs and low, lows. When looking back over my year, there were two distinct groups. The first 6 months were horrible, truly terrible. Then the next 6 months were fantastic, some of the best growth I’ve seen in a while. But it was offset by the terrible first half. A few key points I took away from this year. Stick to your strategy! When I didn’t stick to my strategy, my portfolio paid dearly for that. Once I realised the error of my ways, the climb back to parity was fantastic. I’ll now go over my year in greater detail and provide some stats for you.
Firstly, let’s check out how I compared to my goals set at the start of the year.
| Category | Start of 2020 | 2020 Goal | 2020 Actual |
| Copiers | 25 | 50 | 20 |
| Followers | 1815 | 2100 | 5650 |
| AUM | $46,990 | $75,000 | $13,280 |
| Realised Profits | 0 | 10% | -9.93% |
| Portfolio Growth | 0 | 15% | -3.08% |
| SP500 beat | 0 | TRUE | FALSE (-3% vs 16%) |
| Risk | 4 | 4 | 5 |
| Avg Profit | +9.71% | +10% | +13.36% |
| Avg Loss | -17.21% | < -10% | -16.61% |
The above stats don’t paint a pretty picture. Most of my portfolio stats didn’t meet my goals. So, the only goals I managed to achieve were growth in followers (+211%) and beating my average Profit per trade (+13.3%). Whilst on the surface, this doesn’t look good, when we dive into the two groups I mentioned before (1st half vs 2nd half), you can see why I’m optimistic about 2021.

Take a look at the statistics for Jan – Jun 2020. They aren’t good. I made mistakes, strategies put aside, and lessons learned. Once I have come to terms with this, you can see how it grows from July-Dec 2020, nearly getting back to parity. This is what it looked like on eToro.

2020 eToro Portfolio Yearly Stats
Throughout the year, I closed 900 trades, with 70% of those trades being profitable. The average profit per trade was 13%, whilst the average loss was -16%. Take these figures with a grain of salt as they don’t consider the amount of capital used per trade. A $50 trade making 25% profit is different to a $1000 trade, making a 1.25% profit. One thing you’ll notice in the image below is the 1023 total trades. This is because eToro takes into account closed trades and open trades in this figure. So, I had closed 900 trades at that time but had approximately 123 trades open within my current portfolio.

The average close % for assets closed in 2020 was 5%, and the average duration I held them for was 55 days. Therefore, it was a busy year, trading over 154 different assets across several sectors. One thing to note is that I traded only 45 assets more than 5 times in the year. So approx. 2/3rds of trades were one-off or rarely traded.
My most traded assets were
| Asset | Count |
|---|---|
| Xiaomi Corp | 26 |
| Crowdstrike Holdings | 28 |
| Bitcoin | 35 |
| Enphase Energy Inc. | 38 |
| Ethereum | 38 |
The Above and Beyond Club
So as I’ve done in previous months, I’ve highlighted certain stocks that I’ve closed in significant profit to highlight the Above and Beyond club. I’ll go into detail for these stocks below, but I’m also going to include the Crash and Burn club because I can’t just highlight the good trades without bringing attention to my bad ones.
These are the Above and beyond club tiers
- Bronze: 20 – 25%
- Silver: 25 – 29.99%
- Gold: 30 – 35%
- Platinum: 35 – 39.99%
- Diamond: 40 – 99%
- Centurion: +100%
This is how many I was able to close out in each level
| Tier | Count |
| Bronze | 55 |
| Silver | 17 |
| Gold | 13 |
| Platinum | 27 |
| Diamond | 24 |
| Centurion | 7 |
Crash and Burn tiers
- Blergh: 20 – 25%
- Puke: 25 – 29.99%
- Crappy: 30 – 35%
- Paper hands: 35 – 39.99%
- Rethinking time: 40 – 99%
| Tier | Count |
| Blergh | 23 |
| Puke | 9 |
| Crappy | 7 |
| Paper hands | 8 |
| Rethinking time | 32 |
So, I’m going to use these figures as my base comparison for next year – ensuring that I’m not performing worse than in previous years.
Final thoughts on my 2020 eToro Portfolio
2020 was a year like no other, both in good and bad lessons learned. I understood that I could not stray from my strategy that had proven itself in previous years. Overall, I missed out on many gains on one of the craziest bear and bull markets I have seen in a long time, but that is ok. My time horizon is decades, so 1 year is not going to throw me off course. I’ve learned from it and will take this information into 2021.
Thank you for joining me on the adventure in 2020 and let’s see what 2021 can bring us.
August 2020 – eToro portfolio review
A nice way to finish August, with a strong portfolio gain (+3.04%) and an even stronger realized profit gain (+3.4%).
So, let us take a quick look at the goals that I set at the start of the year and how I am comparing to them.
| Category | Start of 2020 | End of 2020 Goal | YTD (end Aug 2020) |
| Copiers | 25 | 50 | 30 |
| Followers | 1815 | 2100 | 5658 |
| AUM | $46,990 | $75,000 | $40,000 |
| Realised Profits | 0 | 10% | -21.71% |
| Portfolio Growth | 0 | 15% | -17.03% |
| SP500 beat | 0 | TRUE | FALSE (-17% vs 9.5%) |
| Risk | 4 | 4 | 4 |
| Avg Profit | +9.71% | +10% | +15.06% |
| Avg Loss | -17.21% | < -10% | -18.11% |
August 2020 recap
A stronger position this month, with several profitable trades taking place. 60 trades were closed this month, with 55 of those being profitable. The average profit for these trades was 11% which shows a strong position for our portfolio moving forward.
For the 5 trades closed for a loss, the average was -8%, not an ideal figure, but it showed that it is sometimes better to close a trade than deal with continued losses.
The Above and Beyond Club
These stocks are going above and beyond – crushing their returns and setting up our portfolio nicely. For August, these were the seven closed positions that earned the above and beyond status
| Holding | % Gain |
|---|---|
| AES Corp | 39% |
| IIPR (2 x trades) | 30% |
| IIPR | 29% |
| IIPR | 26% |
| Enphase (2 x trades) | 20% |
Now, for all you stat nerds, here’s some metrics related to the portfolio.
Average % gain for each holding
| Market | Average of % Gain |
|---|---|
| AES Corp | 25% |
| Aramark | -4% |
| Cirrus Logic Inc | 1% |
| Citizens Financial Group Inc | 1% |
| ConocoPhillips Co | 6% |
| Crowdstrike Holdings | 11% |
| Enphase Energy Inc. | 20% |
| Enterprise Products Partners LP | 2% |
| Exelixis Inc | -13% |
| Huami Corp. | 10% |
| Innovative Industrial Properties Inc. A | 29% |
| L3Harris | 5% |
| Laboratory Corp of America Holdings | 5% |
| Mastercard | 11% |
| Microchip Technology Inc | 6% |
| Microsoft | 10% |
| ServiceNow Inc | 13% |
| Visa | 6% |
| W.R Grace | -11% |
| Wabtec Corp | 9% |
| Wix.com Ltd | 6% |
| Xiaomi Corp | 12% |
| Average | 9% |
Average duration of the closed positions in my portfolio
| Market | Average Duration (days) |
| AES Corp | 37 |
| Aramark | 7 |
| Cirrus Logic Inc | 31 |
| Citizens Financial Group Inc | 18 |
| ConocoPhillips Co | 14 |
| Crowdstrike Holdings | 55 |
| Enphase Energy Inc. | 18 |
| Enterprise Products Partners LP | 21 |
| Exelixis Inc | 69 |
| Huami Corp. | 15 |
| Innovative Industrial Properties Inc. A | 52 |
| L3Harris | 29 |
| Laboratory Corp of America Holdings | 51 |
| Mastercard | 48 |
| Microchip Technology Inc | 29 |
| Microsoft | 38 |
| ServiceNow Inc | 43 |
| Visa | 48 |
| W.R Grace | 21 |
| Wabtec Corp | 52 |
| Wix.com Ltd | 7 |
| Xiaomi Corp | 14 |
| Grand Total | 36 |
How many trades I closed for each of the holdings.
| Market | Count of trades |
| AES Corp | 3 |
| Aramark | 2 |
| Cirrus Logic Inc | 2 |
| Citizens Financial Group Inc | 2 |
| ConocoPhillips Co | 2 |
| Crowdstrike Holdings | 6 |
| Enphase Energy Inc. | 2 |
| Enterprise Products Partners LP | 1 |
| Exelixis Inc | 1 |
| Huami Corp. | 2 |
| Innovative Industrial Properties Inc. A | 4 |
| L3Harris | 2 |
| Laboratory Corp of America Holdings | 3 |
| Mastercard | 5 |
| Microchip Technology Inc | 1 |
| Microsoft | 3 |
| ServiceNow Inc | 3 |
| Visa | 4 |
| W.R Grace | 2 |
| Wabtec Corp | 4 |
| Wix.com Ltd | 2 |
| Xiaomi Corp | 4 |
| Grand Total | 60 |
Final thoughts on my August eToro Portfolio Review
August has shown the recent adjustment to the strategy is paying (literal) dividends. Locking in profits has increased our realised gain and profitable trades for the month. September is normally a slow month, and with the unprecedented growth, we are potentially looking at a slow month or a pullback, with the tech sector going to be hit the hardest.
Looking forward to what September has in store for us as we add new stocks to our listings and start utilising some of the cash we’ve been holding on to.
July 2020 – eToro portfolio review
Finally – after a few less than desired months, we have ended the month of July in the green +3.39%. So, it’s been the best month this year.
Let us take a quick look at the goals that I set at the start of the year and how I am comparing to them.
| Category | Start of 2020 | End of 2020 Goal | YTD (end July 2020) |
| Copiers | 25 | 50 | 33 |
| Followers | 1815 | 2100 | 5650 |
| AUM | $46,990 | $75,000 | $41,260 |
| Realised Profits | 0 | 10% | -24.62% |
| Portfolio Growth | 0 | 15% | -19.47% |
| SP500 beat | 0 | TRUE | FALSE (-19% vs 1.25%) |
| Risk | 4 | 4 | 3 |
| Avg Profit | +9.71% | +10% | +15.42% |
| Avg Loss | -17.21% | < -10% | -18.85% |
July 2020 recap
A stronger position this month, with several profitable trades taking place. 59 trades were closed this month, with 44 of those being profitable. The average profit for these trades was 14.6% which shows a strong position for our portfolio moving forward.
For the 15 trades closed for a loss, the average was -10.63% not an ideal figure but it showed that it is sometimes better to close a trade, than deal with continued losses.
29 new trades were opened this month, with strong results so far. Many of them in profit, with 5 of them already +15% in profit, so let us see what August has in store for the portfolio.
The Above and Beyond Club
These stocks are going above and beyond – crushing their returns and setting up our portfolio nicely. For July, these were the closed positions that earned the above and beyond status
| Holding | Profit |
|---|---|
| Ethereum | 40.56% |
| Huami Corp. | 39.80% |
| Ethereum | 39.16% |
| Huami Corp. | 38.89% |
| Ethereum | 37.68% |
| Ethereum | 36.40% |
| Ethereum | 36.32% |
| Ethereum | 36.24% |
| Huami Corp. | 24.94% |
| Enphase Energy Inc. | 24.54% |
| Enphase Energy Inc. | 24.46% |
| Enphase Energy Inc. | 24.44% |
| Bitcoin | 22.24% |
| Bitcoin | 21.64% |
| Bitcoin | 21.04% |
| Bitcoin | 20.32% |
Final thoughts on my July eToro Portfolio Review
July has set us up nicely moving forward over the next few months. Expect some volatility as COVID potentially resurges and causes further lockdowns. Earnings reports for a lot of our stocks came out in July and continue into August, so there could be some great news, particularly for our solar and tech stocks.
April – June 2020 weeded out a lot of bad stocks and secured nice gains for other stocks. Looking towards July, we will have to be on our toes as it kicks off reporting season and with many companies withdrawing guidance, we could be seeing another rollercoaster ride.
June 2020 eToro portfolio review
I know it has been a long time between updates so I’m going to do a combined review for April, May and June 2020.
These will be the goals that I’ll try to achieve for 2020 and how I’m going year to date.
| Category | Start of 2020 | End of 2020 Goal | YTD (end June 2020) |
| Copiers | 25 | 50 | 30 |
| Followers | 1815 | 2100 | 5643 |
| AUM | $46,990 | $75,000 | $41,155 |
| Realised Profits | 0 | 10% | -25.66% |
| Portfolio Growth | 0 | 15% | -22% |
| SP500 beat | 0 | TRUE | FALSE (-22% vs -3.56%) |
| Risk | 4 | 4 | 3 |
| Avg Profit | +9.71% | +10% | +15.8% |
| Avg Loss | -17.21% | < -10% | -18.2% |
June 2020 eToro Portfolio Review
What a wild few months it has been for our portfolio. In short, I am not happy with the overall performance and I am continuously looking at how to improve the trading and performance statistics.
etoro Portfolio Review 2020 Growth and dates
- Key Growth Dates and when I achieved them
- 3% – 4 Feb
- 6% – 6th Feb
- 9% – 14th Feb
- 12% – Coming soon!
- 15% – Coming soon!
- 18% – Coming soon!
- 21% – Coming soon!
- 24% – Coming soon!
The Above and Beyond Club
These stocks are going above and beyond – crushing their returns and setting up our portfolio nicely. Aligning with the etoro Club tiers, we have
- Bronze: 20 – 24.99%
- Silver: 25 – 29.99%
- Gold: 30 – 34.99%
- Platinum: 35 – 39.99%
- Diamond: 40 – 99%
- Centurion: +100%
Closed Stocks in the Above and Beyond Club
We’ve been fortunate to have a couple of stocks closed in significant profit since I started recording my portfolio on this blog. So I don’t list all 76 above and beyond members, I’ll highlight the level and how many trades have been closed at that level.
| Row Labels | Closed trades |
| Bronze: 20 – 24.99% | 29 |
| Silver: 25 – 29.99% | 7 |
| Gold: 30 – 34.99% | 2 |
| Platinum: 35 – 39.99% | 15 |
| Diamond: 40 – 99% | 16 |
| Centurion: +100% | 7 |
Let’s hope we add a few more over the coming months!
eToro April – June 2020 Review Closed positions
April – June wasn’t a kind time period for our portfolio. I’m not disheartened as it’s only 3 months out of my trading life. Whilst the portfolio was mostly down, there were some glimmers of hope in some solid stocks. Particularly those that caught the rebound up. I have been more conservative with my trading approach this quarter. Holding on to more cash than normal (about 30% at the moment) and doing a deeper analysis into what I’m buying. I’ve also opted for a dollar-cost average approach where I’ll spread out my purchases over the coming weeks, rather than commit the full allocation amount in one go. As the markets are turbulent at the moment, this is reducing the impact of the market downturn.
Final thoughts on my eToro Portfolio April – June Review so far
April – June 2020 weeded out a lot of bad stocks and secured nice gains for other stocks. Looking towards July, we’ll have to be on our toes as it kicks off reporting season and with many companies withdrawing guidance, we could be seeing another rollercoaster ride.
I’ve got some strong statistics support my trading at the moment. So, I’ll let them do the talking.
Most traded markets
| Market | Number of trades |
| AUS200 | 22 |
| Ethereum | 21 |
| SPX500 | 21 |
| Bitcoin | 19 |
| Enphase Energy Inc. | 17 |
| Dropbox Inc | 12 |
| Qiwi Plc | 11 |
| Oil | 11 |
| Wyndham Destinations Inc | 10 |
| NASDAQ100 | 10 |
| Xiaomi Corp | 10 |
| Microsoft | 10 |
Top 10 highest average profit
| Market | Average of P/L % |
| Atlassian Corp PLC A | 42.03% |
| Dropbox Inc | 29.85% |
| Enphase Energy Inc. | 41.18% |
| iShares MSCI India ETF | 22.74% |
| Morgan Stanley | 22.96% |
| NVIDIA Corporation | 39.96% |
| Six Flags | 26.84% |
| SPX500 | 24.06% |
| StoneCo Ltd A | 26.26% |
| Wayfair Inc. | 35.26% |
Bottom 10 lowest average profit
| Row Labels | Average of P/L $ |
| DJ30 | -26.04% |
| Beyond Meat Inc. | -26.08% |
| Citizens Financial Group Inc | -26.42% |
| Interpublic Group of Companies Inc | -26.99% |
| TVIX | -27.15% |
| Zillow Group Inc | -29.99% |
| ProShares UltraPro Short QQQ | -40.09% |
| Enterprise Products Partners LP | -43.45% |
| Diamondback Energy Inc | -47.52% |
| ConocoPhillips Co | -48.94% |
Types of trades
| Type | Count | Average of P/L % |
| Buy | 306 | 4.32% |
| Sell | 136 | 0.89% |
| Grand Total | 442 |
Which Market?
| Market | # trades | Average of P/L % |
| Commodity | 15 | -16.74% |
| Crypto | 49 | 9.37% |
| ETF | 19 | -6.82% |
| Forex | 10 | -0.01% |
| Index | 81 | 2.20% |
| Stock | 268 | 4.43% |
| Grand Total | 442 |
March 2020 eToro portfolio review
These will be the goals that I’ll try to achieve for 2020 and how I’m going year to date.
| Category | Start of 2020 | End of 2020 Goal | YTD (end Mar 2020) |
|---|---|---|---|
| Copiers | 25 | 50 | 41 |
| Followers | 1815 | 2100 | 5643 |
| AUM | $46,990 | $75,000 | $45,490 |
| Realised Profits | 0 | 10% | -14.90% |
| Portfolio Growth | 0 | 15% | -13% |
| SP500 beat | 0 | TRUE | TRUE (-13% vs -23.55%) |
| Risk | 4 | 4 | 5 |
| Avg Profit | +9.71% | +10% | 17.88% |
| Avg Loss | -17.21% | <-10% | -17.98% |
March 2020 eToro Portfolio Review
Did that really just happen?
After hitting highs around the middle of Feb, the fear factor kicked into gear and the market dropped… hard. Evident by the decrease in AUM, portfolio growth and profits. It was a great opportunity to short the market and we were on the receiving end of some great profits but also hit a number of Stop Losses, which impacted our realised profits. One of the key factors was reducing our crypto holdings. I had been holding on to them for nearly 2 years and thought enough was enough. The number of followers grew off the charts which i’m excited about and our copier numbers grew slowly as well.
We had 21 trades take profit of 20% or more, plus 4 trades taking in over 100%! I continued to look at particular stocks that were caught up in the market downturn but have strong fundamentals. Investing small positions in these over the coming weeks/months will set us up for when the market does decide to return to normal.
** If you don’t have an eToro account – you can set one up here! **
** Already have an eToro account? Check out my profile! **
67% of retail investor accounts lose money when trading CFDs with this provider. You should consider whether you can afford to take the high risk of losing your money.
Note that this does not apply to US Users and eToro USA LLC does not offer CFDs.
Overall, I’m not overly happy with March results but i am happy that we continue to beat the SP500 benchmark. It will be interesting to see how the rest of 2020 plays out.
Current 2020 Open eToro stock positions
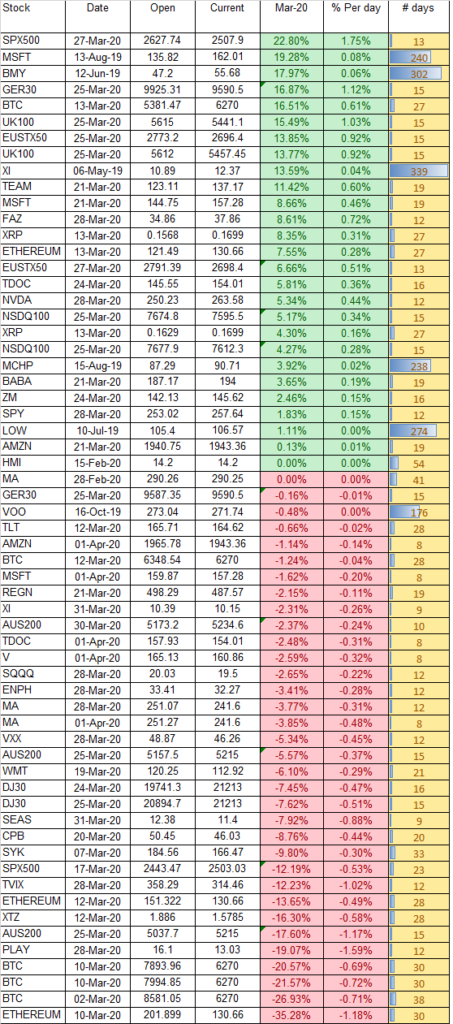
Below is a snapshot of what stocks I’ve opened since measuring my results in 2019 and haven’t yet closed. As you can see, there is a fair bit of red due to the massive slide in the last month or so but that’s alright, there is still plenty of solid green numbers in there. Just under 50% of our positions are in green.
As you can see by the image below, there are a number of shorts and indices open to take advantage of the market situation. the SPX500 is our largest winner at the moment but I suspect that will change over the coming weeks.
etoro Portfolio Review 2020 Growth and dates
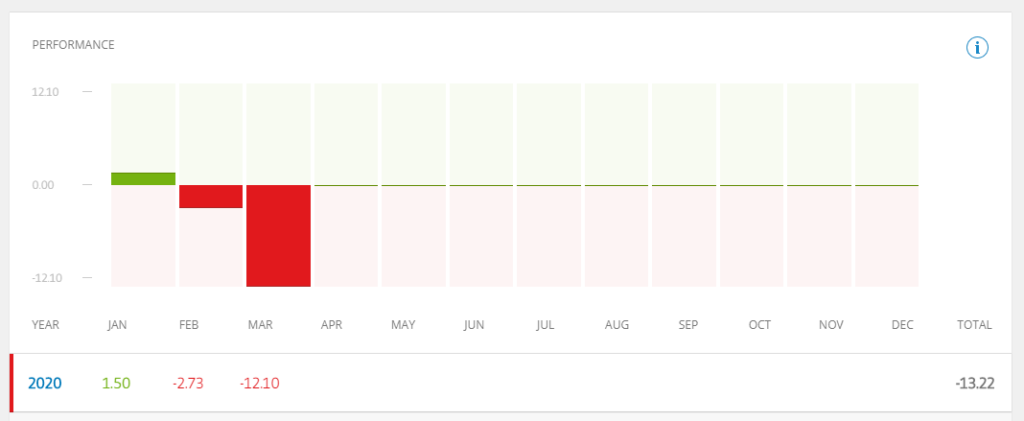
- Key Growth Dates and when I achieved them
- 3% – 4th Feb
- 6% – 6th Feb
- 9% – 14th Feb
- 12% – Coming soon!
- 15% – Coming soon!
- 18% – Coming soon!
- 21% – Coming soon!
- 24% – Coming soon!
The Above and Beyond Club
These stocks are going above and beyond – crushing their returns and setting up our portfolio nicely. Aligning with the etoro Club tiers, we have
- Bronze: 20 – 24.99%
- Silver: 25 – 29.99%
- Gold: 30 – 34.99%
- Platinum: 35 – 39.99%
- Diamond: 40 – 99%
- Centurion: +100%
Our current open positions include
Bronze
- SPX500 22.80%
Closed Stocks in the Above and Beyond Club
We’ve been fortunate to have a couple of stocks closed in significant profit since I started recording my portfolio on this blog. For multiple closes, I’ll just add the figure to the line
- $ENPH = 121% (Centurion)
- $SPX500 x4 = 118%, 118%, 114%, 110% (Centurion)
- $AUS200 x3 = 82.28%, 54.01%, 49.57% (Diamond)
- $SPX500 x3 = 81.22%, 80.94%, 63.51% (Diamond)
- $ENPH x2 = 55.32%, 53% (Diamond)
- $FRA40 = 57.22% (Diamond)
- $DBX = 40% (Diamond)
- $SIX = 39.53% (Platinum)
- $MSFT = 35.77% (Platinum)
- $URI = 35.31% (Platinum)
- $CVS = 32.25% (Gold)
- $SIX = 31.30% (Gold)
- $PVH = 25.92% (Silver)
- $AUS200 = 25.39% (Silver)
- $LYV = 23.68% (Bronze)
- $AUS200 = 23.38% (Bronze)
- $MS = 23% (Bronze)
- $WYND = 22.81% (Bronze)
- $INDA = 22.74% (Bronze)
- $SPX500 = 22.05% (Bronze)
- $JEC= 20.83% (Bronze)
- $XI = 20.53% (Bronze)
- $FIS = 20.10% (Bronze)
Let’s hope we add a few more over the coming months!
eToro March 2020 Review Closed positions
March wasn’t a particularly good month. I did take the opportunity to clean up a lot of bad trades that I could no longer justify holding on to. I had a lot of dead weight in terms of stocks that no longer presented any value to our portfolio. Our biggest loses came from crypto and indices hitting stop losses.
Below are the different markets that I closed during March, sorted by % Profit/loss. As I had so many positions per stock closed, I’ve averaged the Profit/Loss % for each line to save you reading too much.
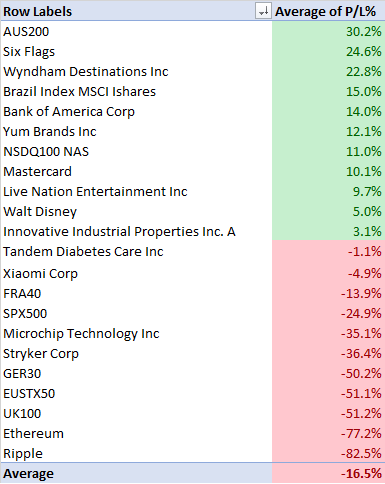
Final thoughts on my eToro Portfolio Review so far
March was a drop and a half! We’ve cleaned out some bad stocks, had some great returns after an earnings report. I’ve bought some solid stocks that are fundamentally strong and great potential, so we’re setting ourselves up for the future. The coronavirus has impacted the market and will continue to do so for months to come.
February 2020 eToro portfolio review
These will be the goals that I’ll try to achieve for 2020 and how I’m going year to date.
| Category | Start of 2020 | End of 2020 Goal | YTD (end Feb 2020) |
|---|---|---|---|
| Copiers | 25 | 50 | 38 |
| Followers | 1815 | 2100 | 3355 |
| AUM | $46,990 | $75,000 | $52,766 |
| Realised Profits | 0 | 10% | -2.63% |
| Portfolio Growth | 0 | 15% | -2.55% |
| SP500 beat | 0 | TRUE | TRUE (-2.55% vs -10.80%) |
| Risk | 4 | 4 | 3 |
| Avg Profit | +9.71% | +10% | 15.57% |
| Avg Loss | -17.21% | <-10% | -13.82% |
February 2020 eToro Portfolio Review
What
A
Month!
After hitting highs around the middle of Feb, the fear factor kicked into gear and the market dropped… hard. It was a mixed bag of results, with stocks like $ENPH jumping 70% in the month, to other ones hitting -50%. There was a massive jump in followers and copiers for the month. Followers nearly doubled and copiers climbed nearly 47%! It is a shame that February wasn’t the best month but there was a silver lining – buying good solid stocks for a significant discount. This was helped by stockpiling cash for a few months previously, giving me the opportunity to buy small positions here and there.
Overall, I’m happy with the progress so far in 2020 and can’t wait to see what I can achieve for the rest of the year.
My stock choices since the start of 2019 have produced solid results. Last year in 2019, my portfolio grew by over 31% and it was continuing to the middle of Feb but has come full circle and ending up -1% year to date.
Current 2020 Open eToro stock positions
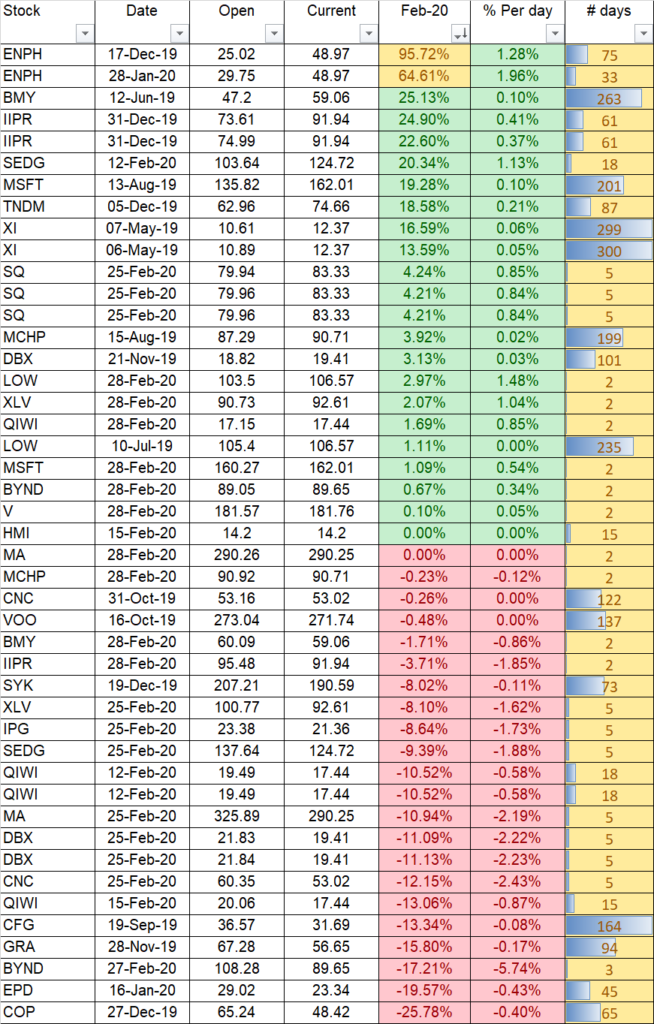
Below is a snapshot of what stocks I’ve opened since measuring my results in 2019 and haven’t yet closed. As you can see, there is a fair bit of red due to the massive slide in the last week or so in Feb but that’s alright, there is still plenty of solid green numbers in there. Just over 50% of our positions are in green.
Massive congratulations to $ENPH with the two positions sitting on 95% and 65%. The next closest is BMY on 25%, so there is quite the difference. This was on the back of ENPH’s huge earnings report where it jumped 42% in one day. TO give an indication of the slide, it was around 125% profit at one stage. I didn’t take any chances when it reached that level and I’ll close some partial trades of the stock, locking in some profits. It made so much profit that we had to make it into the new above and beyond level – Centurion Club. This is for the exclusive stocks that make it above 100%!! We also have another 4 stocks in the +20% profit margin which is great, considering the drop that decimated a lot of stocks.
Portfolio Growth and dates
- Key Growth Dates and when I achieved them
- 3% – 4th Feb
- 6% – 6th Feb
- 9% – 14th Feb
- 12% – Coming soon!
- 15% – Coming soon!
- 18% – Coming soon!
- 21% – Coming soon!
- 24% – Coming soon!
The Above and Beyond Club
These stocks are going above and beyond – crushing their returns and setting up our portfolio nicely. Aligning with the etoro Club tiers, we have
- Bronze: 20 – 24.99%
- Silver: 25 – 29.99%
- Gold: 30 – 34.99%
- Platinum: 35 – 39.99%
- Diamond: 40 – 99%
- Centurion: +100%
Our current open positions include
Diamond
- ENPH 95.72%
- ENPH 64.61%
Silver
- BMY 25.13%
Bronze
- IIPR 24.90%
- IIPR 22.60%
- SEDG 20.34%
Closed Stocks in the Above and Beyond Club
We’ve been fortunate to have a couple of stocks closed in significant profit since I started recording my portfolio on this blog.
- $ENPH = 121% (Centurion)
- $ENPH = 53% (Diamond)
- $DBX = 40% (Diamond)
- $MSFT = 35.77% (Platinum)
- $URI = 35.31% (Platinum)
- $CVS = 32.25% (Gold)
- $PVH = 25.92% (Silver)
- $MS = 23% (Bronze)
- $JEC= 20.83% (Bronze)
- $XI = 20.53% (Bronze)
- $FIS = 20.10% (Bronze)
Let’s hope we add a few more over the coming months!
Open stocks – February 2020
eToro February 2020 Review Closed positions
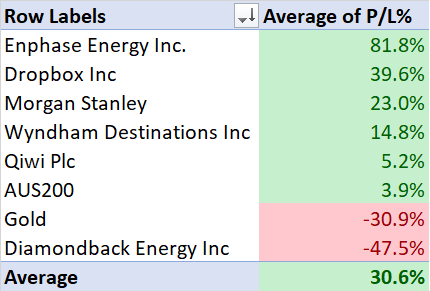
February wasn’t a particularly good or bad month. I did take the opportunity to clean up a lot of bad trades that I could no longer justify holding on to. I had a lot of dead weight in terms of stocks that no longer presented any value to our portfolio. Our biggest loses came from oil companies and Gold.
Below are the different markets that I closed during February, sorted by % Profit/loss. As I had so many positions per stock closed, I’ve averaged the Profit/Loss % for each line to save you reading too much.
New Stocks added to my eToro portfolio
I’ve been quite a busy little boy this month! Due to the drop in the market and having a nice cash reserve, I decided to buy some stocks that still had great fundamentals but just dipped because everyone else was doing it.
This is what I bought this month
- BMY
- BYND (2 positions)
- CNC
- DBX (2)
- HMI
- IIPR
- IPG
- LOW
- MA (2)
- MCHP
- MSFT
- QIWI (4)
- SEDG (2)
- SQ (3)
- V
- XLV (2)
It will interesting to see how these new additions play out in the months to come. Once the market plateau, we should be in a good position once it decides to return to profit.
Final thoughts on my eToro Portfolio Review so far
February was a literal rollercoaster! We’ve cleaned out some bad stocks, had some great returns after an earnings report. I’ve bought some solid stocks that are fundamentally strong and great potential, so we’re setting ourselves up for the future. The coronavirus has impacted the market and will continue to do so for months to come.
January 2020 eToro Portfolio Review
January 2020 goals
| Category | Start of 2020 | End of 2020 Goal | YTD (Jan 2020) |
|---|---|---|---|
| Copiers | 25 | 50 | 26 |
| Followers | 1815 | 2100 | 1846 |
| AUM | $46,990 | $75,000 | $49,090 |
| Realised Profits | 0 | 10% | -3.83% |
| Portfolio Growth | 0 | 15% | 1.50% |
| SP500 beat | 0 | TRUE | TRUE (-0.16% vs 1.5%) |
| Risk | 4 | 4 | 3 |
| Avg Profit/Loss | +9.71% | +10% | 10.82% |
| -17.21% | <-10% | -15.67% |
There are a few positive and negative outcomes from the start of 2020. Copier numbers have grown, as well as people adding me to their watchlist. Whilst the growth isn’t significant (by 1 and 31 respectively) but it tells me there is interest in my account. As you can see, my portfolio beat the SP500 YTD. the SP500 is an important benchmark on which a lot of traders pit themselves against. This is because we want our portfolio to be better than just sticking it in an index fund and letting it run its course.
Overall, I’m happy with the progress for 2020 and can’t wait to see what I can achieve for the rest of the year.
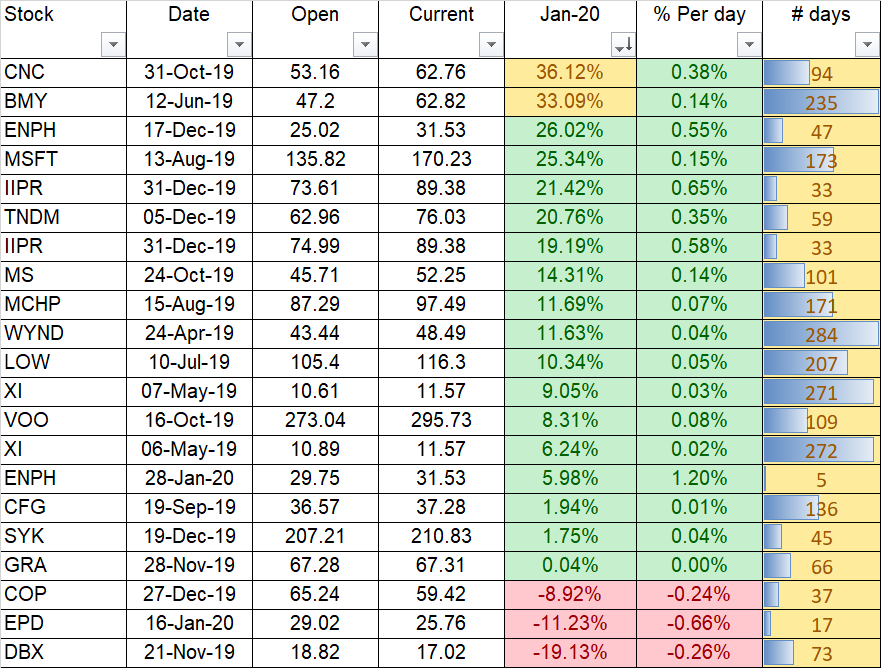
My stock choices since the start of 2019 have produced solid results. Last year in 2019, my portfolio grew by over 31% and the positive trend continues. Below is a snapshot of what stocks I’ve opened and haven’t closed yet in 2019.
Current 2020 Open eToro stock positions
As you can see, there is more green than red, which is always a good thing. CNC and BMY are crushing it at the moment, with over 36% and 33% respectively, since buying them. Another 4 stocks are in the +20% mark which gives us some great options if we were to take profit with these stocks.
Portfolio Growth and dates
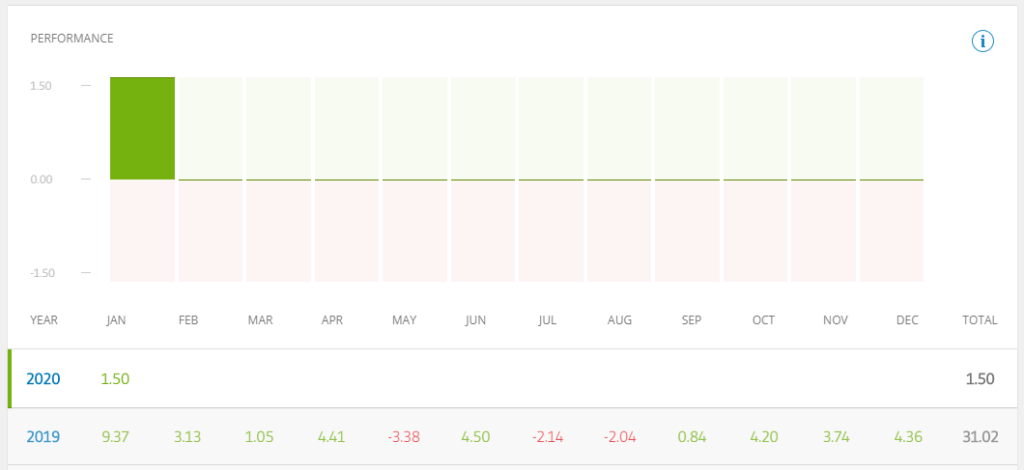
- Key Growth Dates and when I achieved them
- 3% – Coming soon!
- 6% – Coming soon!
- 9% – Coming soon!
- 12% – Coming soon!
- 15% – Coming soon!
- 18% – Coming soon!
- 21% – Coming soon!
- 24% – Coming soon!
The Above and Beyond Club
These stocks are going above and beyond – crushing their returns and setting up our portfolio nicely. Aligning with the etoro Club tiers, we have
- Bronze: 20 – 24.99%
- Silver: 25 – 29.99%
- Gold: 30 – 34.99%
- Platinum: 35 – 39.99%
- Diamond: over 40%
Our current open positions include
Platinum
CNC 36.12%
BMY 33.09%
Closed Stocks in the Above and Beyond Club
We’ve been fortunate to have a couple of stocks in 2019 closed in significant profit
$MSFT = 35.77% (Platinum)
$URI = 35.31% (Platinum)
$CVS = 32.25% (Gold)
$PVH = 25.92% (Silver)
$JEC= 20.83% (Bronze)
$XI = 20.53% (Bronze)
$FIS = 20.10% (Bronze)
Let’s hope we add a few more over the coming months!
eToro January 2020 Review Closed positions
I have taken a different reporting approach for my 2019 closed positions. I realised, if I’m only showing stocks I’ve open in 2019, then I should only be reporting on those same stocks which I have closed in 2019. Each stock has been bought and sold since the start of 2019.
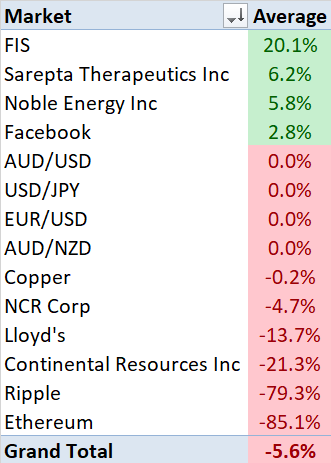
January was a mixed month. I had a lot of dead weight in terms of stocks that no longer presented any value to our portfolio. I felt that it was time for it to be removed from our eToro Portfolio. We had success with FIS and closed some decent profit with SRPT and NBL. I had mixed results with FOrext which closed in the negative but only for a small loss. Our biggest loses came in the form of cryptocurrencies. I closed off only some of my positions which reduced our exposure to the crypto market.
Below are the different markets that I closed during January, sorted by % Profit/loss
New Stocks added to my eToro portfolio – January
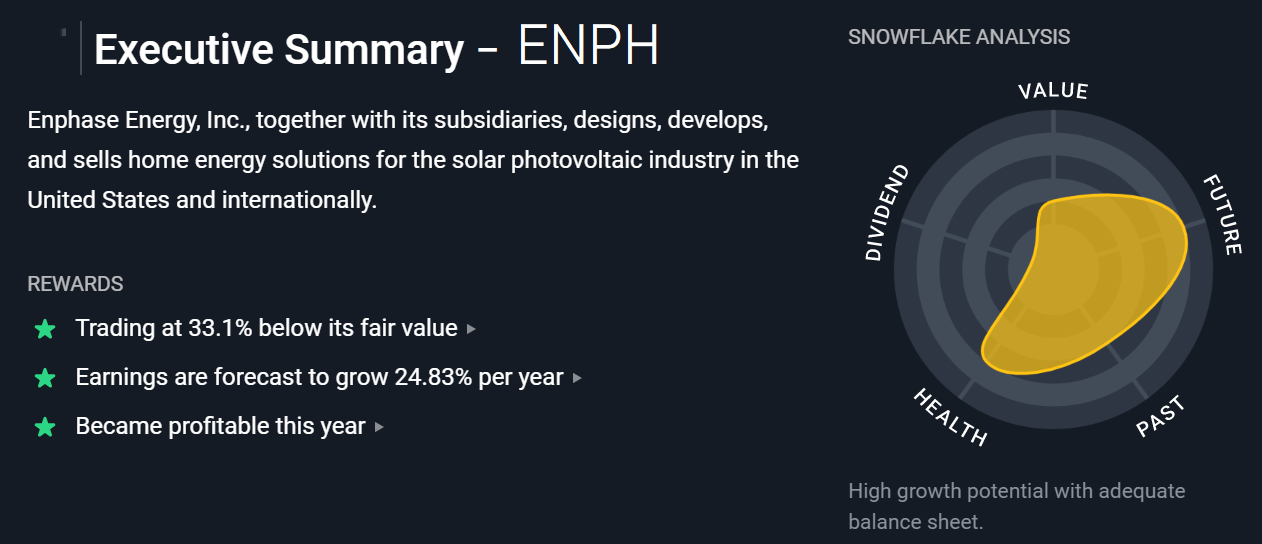
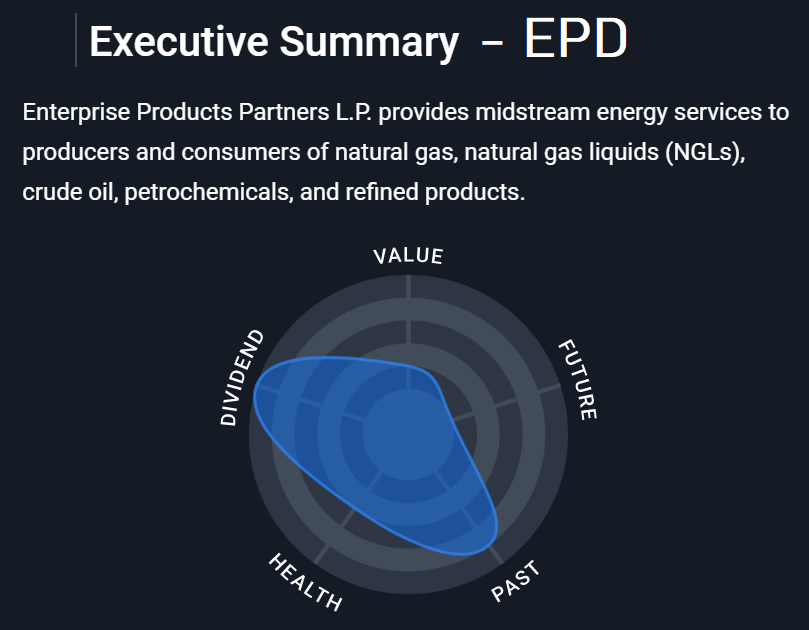
I increased my holding in $ENPH again and also $EPD
Below are the latest stocks added to our portfolio.
$ENPH – Enphase Energy
$EPD
Hopefully, these stocks provide a great return for months to come!
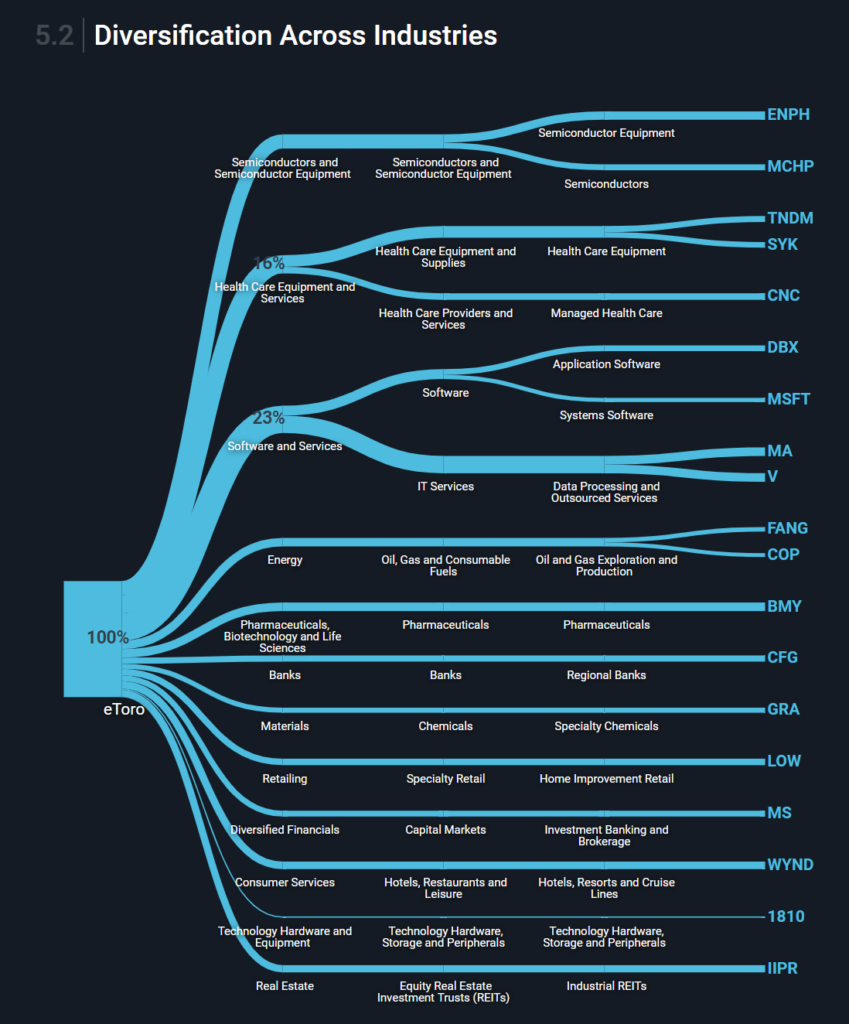
My current eToro Portfolio going into 2020
Below is my current holdings going into Feb 2020 and the breakdown.
Final thoughts on my eToro Portfolio Review so far
January was a month of cleaning out the closet and looking forward to a February. We’ve got some solid stocks in our portfolio and hopefully, this coronavirus doesn’t impact the market too much.
Thanks for checking out my portfolio review.
Remember to Stock Up with Joe
If you’re looking for people to copy, why not check out my latest list of people from my Top Copy Traders Competition.

